LAS
VEGAS VALLEY
CARBON MONOXIDE SATURATION STUDY
Don
Lehrman, Robert A. Baxter, David H. Bush,
William R. Knuth, Derek Lehrman
T&B
Systems, 859 Second St., Santa Rosa, CA 95404
Phone: 707-526-2775, Fax: 707-579-5954,
Email: donl@tbsys.com
Paul
M. Fransioli
7501 E. Lake Mead Blvd. #9-621, Las Vegas, NV 89128,
Email:
j3aqm@att.net
ABSTRACT
This
paper presents an overview of a recent (2001) "saturation" study to
measure carbon monoxide (CO) levels in the Las Vegas Valley of Nevada. The study
was performed during a seasonal period that historically experiences CO levels
that exceed the 8-hour National Ambient Air Quality Standard (NAAQS). The purpose
of the Las Vegas CO Saturation Study was 1) to identify geographic patterns of
CO concentrations, including potential areas with higher concentrations not previously
known, and 2) to determine if the routine CO monitoring station locations are
representative of areas that experience the higher CO levels.
The study began
with a network of 32 continuous CO samplers operating throughout the Las Vegas
Valley. Stations were added during the program to refine the spatial distribution
of higher concentrations, ending with 63 stations. The CO monitors utilized had
never been operated in this type of study but proved to be very accurate, reliable,
and easily operated as long as specific procedures were followed. A mobile van
equipped with an EPA equivalent CO analyzer and position recording operated as
well during periods when higher CO concentrations were likely to occur. An extensive
quality assurance program added credibility to the results.
The primary result
of the study was to confirm that the routine monitoring station locations were
representative of the higher CO concentrations in the Valley. Maps with isopleths
of the highest 8?hour average CO concentrations were developed based exclusively
on the saturation network sites. It was found that the routine network sites were
indeed located where the peaks levels occurred. Moreover, the gradients were for
the most part well defined by the existing network
.
INTRODUCTION
The
Clark County, Nevada, Department of Air Quality Management (DAQM) contracted with
Technical & Business Systems (T&B Systems) for a "saturation"
study of carbon monoxide (CO) concentrations during the seasonal period from before
Thanksgiving to after New Year's Day, specifically, November 20, 2001 through
January 5, 2002. Historically, this is the most likely period to have the highest
CO concentrations measured by the County's air monitoring network. The study objectives
were to:
· Obtain additional CO concentration information in areas
where the exceedances of the NAAQS for CO have been experienced,
·
Improve the conceptual understanding of the relationship between land use, meteorology,
and ambient CO concentrations,
· Identify geographic areas with
high CO concentrations to support risk assessment and potential population exposure
to CO exceedances, and
· Evaluate the current Clark County DAQM
monitoring network CO sampling locations in accordance with U.S. Environmental
Protection Agency (EPA) siting criteria.
In short, the study was planned
to answer two primary questions: are the DAQM monitoring sites adequately identifying
the highest 8?hour average concentrations occurring in the metropolitan Las Vegas
Valley area, and what geographic areas are affected by high CO concentrations?
Prior to 1999, at least one 8?hour average per year exceeded the primary NAAQS
for CO, 9 parts-per-million (ppm). Aggressive efforts to reduce CO emissions have
contributed to the significant decline in exceedance occurrences; none have been
recorded since 1998. The saturation study was planned to provide the information
to assess the adequacy of the spatial distribution of County DAQM monitoring sites.
The technical approach to meeting the study objectives was to operate a network
of CO monitoring sites throughout the Valley, with emphasis on the locales historically
most likely to experience the highest CO concentrations and where rapid recent
development has occurred. Increasing the number of sampling locations well above
the number of sites in the DAQM monitoring network effectively "saturated"
the community with sampling locations and provided the data needed to achieve
the study objectives. The Saturation Network was achieved by a combination of
fixed (called "Static") sites and moveable (called "Dynamic")
sites operated during the anticipated worst-case meteorological conditions. The
samplers ran nearly continuously at the monitoring sites, producing a complete
record of CO concentrations at the selected locations. Another element in saturating
the Valley with measurements was conducting mobile sampling using an instrumented
van during select CO episodes. The van was driven around the Valley to observe
CO loading in a real-time mode during nighttime and early-morning hours when meteorological
conditions conducive to peak CO concentrations occur.
The network monitoring
sites were located throughout the Las Vegas Valley, with a higher density east
of the downtown area. Previous monitoring and modeling results indicated this
to be the most likely area to encounter higher CO concentrations during periods
of typical worst-case meteorological conditions and higher CO emission rates.
The dynamic sites were located both to increase the density of sampling locations
in the static network and to test other areas that might produce higher CO concentrations
due to expected airflow pathways. As dynamic sites were installed and the preliminary
data appeared useful in delineating spatial CO patterns, many were left operating
continuously to maximize the amount of information collected.
INSTRUMENTATION
Two
types of CO sampling instrumentation were used to collect the CO data. The CO
samplers used in the network study sites were manufactured by Onset Computer Corporation
(Onset). The samplers are small, self-contained units that include the CO sampler
and a data logger. The primary CO sampling in the mobile van used during the Intensive
Operating Periods (IOP) was a Dasibi 3003 CO analyzer.
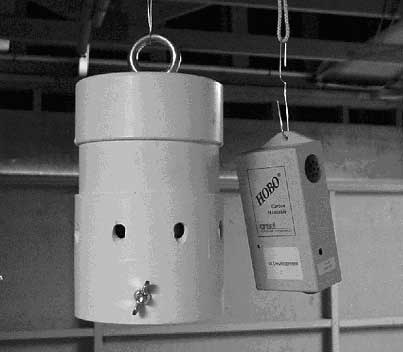
The Onset CO analyzer,
shown in Figure 1, consists of an electrochemical sensor and on-board data logger
housed in a rectangular plastic container about 4-inches long by 3-inches wide
and 1.5 inches high. The sampler was housed in a polyvinyl chloride (PVC) circular
pipe section closed on the top with a grate on the bottom and holes in the side
for air circulation. EPA recognizes the virtual impossibility of operating a network
of reference analyzers in the density needed for a saturation study. Hence, various
saturation studies have utilized non-reference sampling methods with appropriate
comparisons to ensure adequacy of the information for the intended purposes. Preliminary
tests in sampling chambers and the ambient environment coupled with comparative
results from samplers collocated with DAQM designated equivalent analyzers at
monitoring sites and in the mobile sampling van all showed excellent justification
for recognizing results from the samplers as adequate for the purposes of this
study.
Figure 1. Onset CO Analyzer and Enclosure
Extensive
testing of the samplers was performed prior to proposing their use in this study
because the CO samplers had not yet been used for an ambient measurement application.
During testing, individual sampler calibration responses were measured using a
Dasibi 3003 CO analyzer. These responses were used in data processing. During
operations, aggressive quality control checks and operating samplers at two sites
collocated with DAQM sites typically receiving higher CO concentrations helped
to provide good comparability of results from the Study samplers and the DAQM
CO monitors.
Additional tests were performed to ensure that natural ventilation
through the polyvinyl chloride cylindrical tube housings would provide an adequate
time response to changing CO concentrations. The initial response to increasing
CO concentrations was at least as quick as that of the Dasibi analyzer, but a
small lag time in the Onset sampler response was noted during decreasing concentrations.
This lag was shown to be inherent in the detector technology and not in the natural
ventilation of the sampler housing.
Other tests also indicated a small temperature
dependence in the Onset sampler response. This temperature relationship was further
defined by both laboratory-controlled conditions and by comparing the collocated
measurements made in the field (between the DAQM Dasibi analyzer and the Onset
sampler) during field conditions occurring in the Study. The relationship was
applied during data processing.
To aid in the spatial mapping of CO concentrations
and assess the adequacy of the placement of the fixed site sampling network, a
van was outfitted for mobile CO monitoring. The mobile van was a late model sport-utility
vehicle known to have low CO emissions, minimizing the potential impact of the
van on the measurements. The real-time observations mapped the horizontal extent
of the CO plume and aided in understanding the areas of highest concentration
for placement of fixed site samplers during episodes. The sampling van traversed
the Valley in two general modes. One pattern was cross-section passes to identify
possible new areas of higher concentrations not covered by the Saturation Network.
The other pattern was a close inspection of the immediate area in the vicinity
of DAQM and Saturation Network sites to identify possible higher CO concentrations.
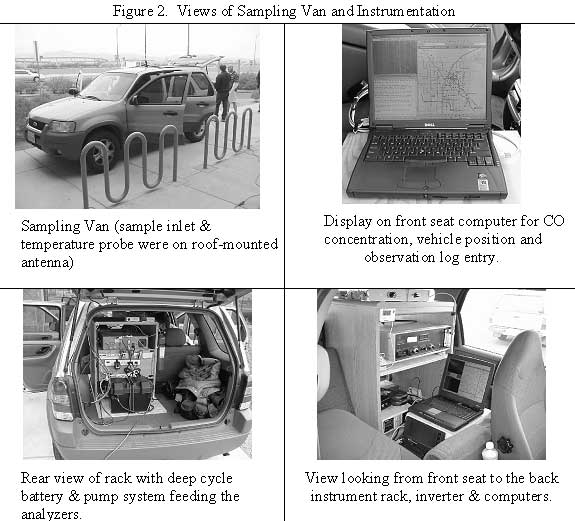
Figure 2 shows several views of the vehicle with the sampling probe mounted
on the roof. This inlet height allowed sampling above the level of the tailpipe
emissions and in the region of generally well-mixed air. The sample was drawn
through the inlet by a pump system supplying air both to a Dasibi 3003 CO analyzer
and to two Onset CO analyzers configured in a series flow arrangement. The first
Onset CO sampler was programmed to collect data at 5-second intervals to help
identify possible "spikes" (rapid rise and fall in concentration) possibly
due to nearby vehicles. A laptop computer polled the second Onset CO sampler at
one-second intervals to compute one-minute averages. CO readings from the Dasibi
3003 were also collected at one-second intervals and stored as 1-minute averages
on a Campbell CR10 data logger and subsequently by the laptop computer. The CR10
data logger also recorded the outside air temperature from a platinum RTD probe
mounted on the support rod for the sample inlet. The temperature data were recorded
at the end of each minute.
The mobile van position was monitored by a Garmin
Etrex Global Positioning System (GPS) and recorded by a laptop computer. One-second
position readings were calculated to 1-minute averages of latitude, longitude
and altitude. Once each minute the Dasibi, Onset analyzer and GPS data files were
merged and a graphical "strip chart" type display of the data was updated
on two laptop computers. This real-time display allowed "scrolling"
capabilities to look back in time at past data. A second GPS receiver provided
the real-time position to a street map display on the same two laptop-computers
as the strip chart display. One of the computers was in the front seat where a
scientist evaluated the data in real time and kept a log of events. The three
computers were networked through a LAN hub and the computer times synchronized
prior to the start to assure proper updating of the real-time files. Finally,
on selected routes, pictures from a digital camera mounted with a forward view
were recorded on the laptop computer located in the front seat.
Figure
2. Views of Sampling Van and Instrumentation
QUALITY
ASSURANCE
Quality
assurance was a fundamental portion of all phases of the study. The activities
included equipment tests and data validation following U.S. EPA monitoring guidance,
and network siting following a standard operating procedure written for the study.
In addition:
· The equipment and gas standards used in the study
underwent acceptance tests prior to use in data collection.
· Independent
audits were conducted of all major components of the study.
· Sites
were visited and reviewed against EPA criteria for siting micro-, middle-, and
neighborhood-scale CO monitoring scales.
· Performance audits of
the Onset monitors and the sampling van monitors were conducted. The audits consisted
of exposing the monitors to three CO concentrations (0, 10.35 and 25.2 ppm). The
audits were conducted using the same standards used during the audit the County's
CO monitoring network.
· A systems audit was conducted of the study's
data processing effort at the T&B Systems facility in Santa Rosa, CA. The
audit consisted of interviews with key data processing personnel, and included
tracking raw data points through the data processing effort to verify that procedures
were being followed.
· During the course of the field program, there
were routine zero and span quality control checks performed on the CO measurement
equipment.
· Comparative testing.
Comparative testing consisted
of both multiple Onset CO analyzers collocated, and Onset CO analyzers collocated
with standard (Dasibi) CO monitors at DAQM sites that used FRM equipment. The
latter comparisons were conducted at two sites selected because they typically
experienced high CO levels and were easily accessible. Measurements were made
continuously for the extent of the field study.
Both 1-hour and 8-hour averaged
Onset data were compared with the DAQM monitor data set. The initial comparison
was conducted using Onset measurements corrected only for calibration span (slope).
It was noted that differences between the collocated instruments showed a distinct
diurnal pattern, i.e., the Onset analyzers read lower than the Dasibi units during
the nighttime and greater during the daytime. This was consistent with results
of our cold-chamber tests of the Onset CO analyzer in which the calibrations appeared
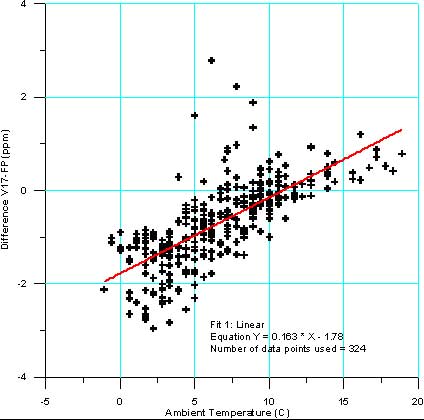
to be sensitive to ambient temperature. The relationship between monitor differences
at the two sites and ambient temperature can be observed in Figure 3, which shows
the differences observed at one of the sites, Freedom Park, as a function of ambient
temperature.
The results of applying an adjustment to the Onset measurements
for this bias improved the correlation between the two methods and reduced the
standard deviation of the differences significantly. After adjustment for ambient
temperature, 92 percent of the differences were less than 1 ppm and all were less
than 2 ppm at the second site (Crestwood).
Peak daily 8-hour averages using
the adjusted and validated data sets were next compared with the County's collocated
measurements. The average difference between the instruments was 0.26 and 0.29
ppm for Freedom Park and Crestwood, respectively, well within the accuracy of
the equipment. The standard deviation of the differences was 0.55 and 0.53 ppm,
respectively which was well within the requirements for the study.
All the
individual Onset samplers were calibrated in a chamber using "zero"
(pure) and NIST traceable concentrations of CO gas. The sampler responses were
checked throughout the program to ensure continued performance within the quality
control guidelines. Sampler responses to ambient conditions were recorded on a
1-minute interval as the raw data. The raw data were transferred to a standard
computer database at frequent intervals and immediately reviewed by the field
personnel to ensure proper operation. In this manner, problems were identified
and corrected in a timely manner.
Figure 3. Differences Between Onset and
Dasibi CO Analyzers vs. Ambient Temperature - Freedom Park
RESULTS
Comparisons between the Onset samples and collocated CO measurements made
by DAQM reference analyzers at two select sites indicated a small diurnal cycle
bias of the Onset readings, generally less than 0.5 ppm. This bias apparently
depends on ambient air temperature. Thus, in addition to factoring the individual
sampler multipoint calibration responses, a correction was also made for the apparent
temperature bias. The corrected data files were then used in the statistical analysis
to determine the comparability of the Saturation Network results and the DAQM
routine network results.
The analysis task consisted of two major elements:
the Saturation Network of fixed sites and the mobile sampling with the monitoring
van. The geographic distribution of CO concentrations throughout the Valley as
defined by the Saturation Network of fixed sites was determined for those periods
of observed high levels and for the overall maximum levels experienced during
the field study. The maximum impacted areas were then compared with the locations
of the DAQM sites. The mobile sampling measurements mapped the CO distribution
to verify that the Saturation network was correctly configured to identify peak
CO concentrations, and provided justification for Dynamic sites that were installed
during the course of the field study.
Saturation Network Sampling
The major
objective of this study was to determine if the DAQM CO Network captures peak
CO ambient concentrations, and is representative of the CO exposure levels in
the Las Vegas Valley. As can be seen from Figure 4, this appears to be the case.
In the figure, isopleths of the peak running 8-hour averaged CO levels generated
from the Saturation Network data for the period of the field study (November 20,
2001 to January 5, 2002) are shown. The locations of the existing DAQM sites that
measure CO are shown as well. Of particular note is that there is a concentration
of DAQM sites in the most severely impacted area. The Sunrise Acres (SA) site
was ideally located to measure maximum levels as defined by the Saturation Network.
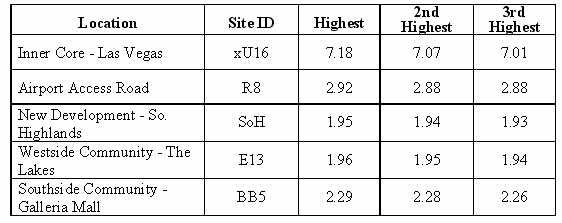
Generally low CO concentrations (peaks <2.5 ppm) were experienced in the fringe
areas outside the inner core. A sense of the CO gradient between the core and
the outer areas in the Las Vegas Valley is provided by the sample of peak concentrations
at select locations in the Valley shown in Table 1. The latter four sites in the
table represent suburban areas and were exposed to significantly lower CO levels
than in the urban core.
Figure 4. Peak 8-hour Average CO (ppm) for Period
November 20 to January 5 Showing DAQM CO Sites
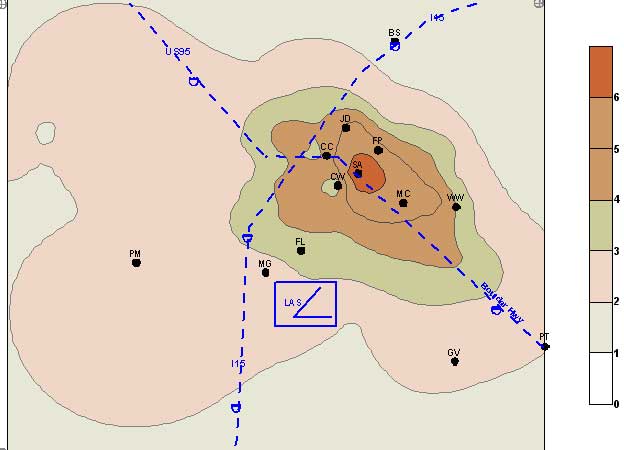
Table 1. Peak 8-hour CO Concentrations (ppm) from Select Sites in the
Saturation Network
Mobile
Sampling
The sampling van operated during two episodic periods-- from December
16 to 20 and December 26 to 29. Seven sampling events were conducted during the
first episode, and four during the second one. Space does not allow a discussion
of even the highlights of the monitoring. However, sampling on the evening of
December 27-28 provides an interesting example of our findings.
The overall
CO observations during the sampling period are depicted in Figure 5. In the figure,
concentrations are shown color-coded relative to the key on the left side. As
can be seen concentrations over essentially the entire Las Vegas Valley were mapped
during each run. Key findings from the run include:
· Mapping performed
on the west side around the new developments and casinos showed no significant
concentrations of CO. Although not initially expected, this observation is consistent
with the fleet of low emissions new cars generally operating in the so-called
Las Vegas Strip.
· As generally supposed by the Clark County DAQM,
the most significant concentrations of CO were not on either the extreme east
or west side of the Valley, they were found back in the inner core region around
the intersection of Charleston Blvd., Eastern Avenue, and Fremont Street. Figure
6 shows the numeric concentration values in this area with some of the highest
values seen off of the major streets. Given the lack of automobile sources, the
CO may be more related to home or water heating related sources. Mobile sampling
repeatedly observed high CO levels in neighborhoods away from the major streets
and was not related to adjacent vehicle sources.
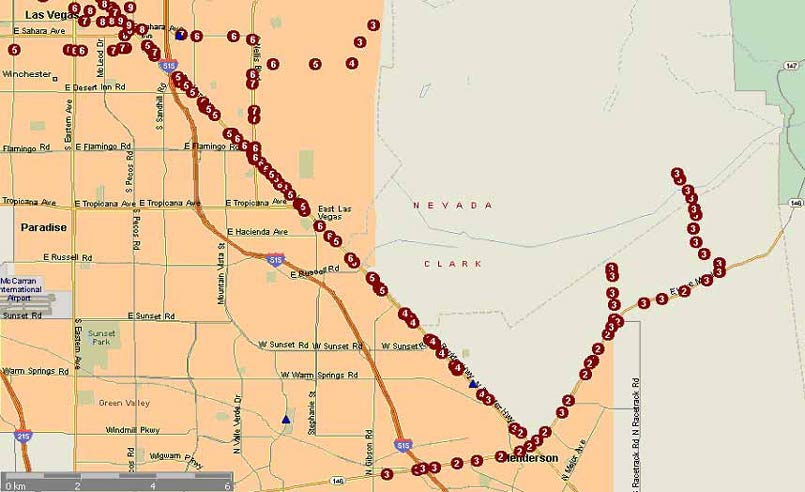
· Traverses made down
Boulder Hwy showed the plume extending almost to Henderson. Tracing the plume
out along East Lake Mead Drive and down into the low areas where drainage would
occur showed slightly elevated concentrations in the low areas that would be draining
toward Lake Mead. Figure 7 shows the observed CO concentrations along the southeast
portion of the sampling van track.
Figure 5. Observed CO Concentrations
(ppm) During December 27 to 28 Evening/Night Period
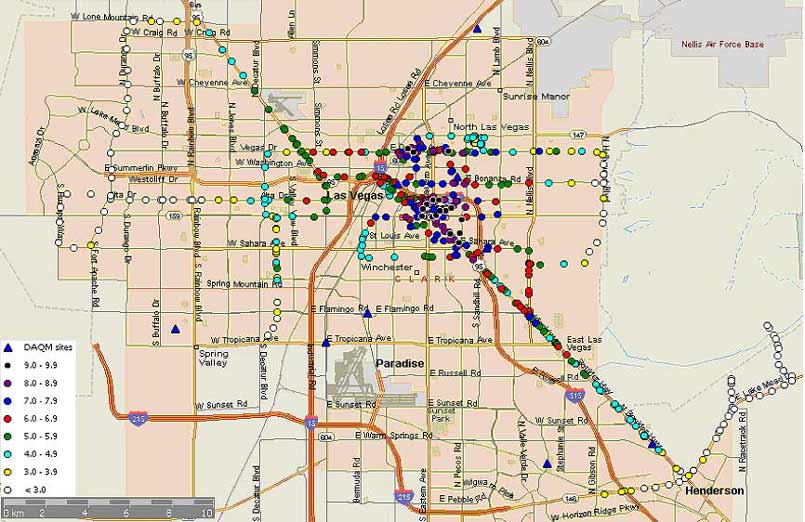
Figure 6. Observed Numeric CO Concentrations (ppm) During December
27 to 28 Evening/Night Period in the Region of the Sunrise Acres Site. The DAQM
sites are shown in blue triangles.
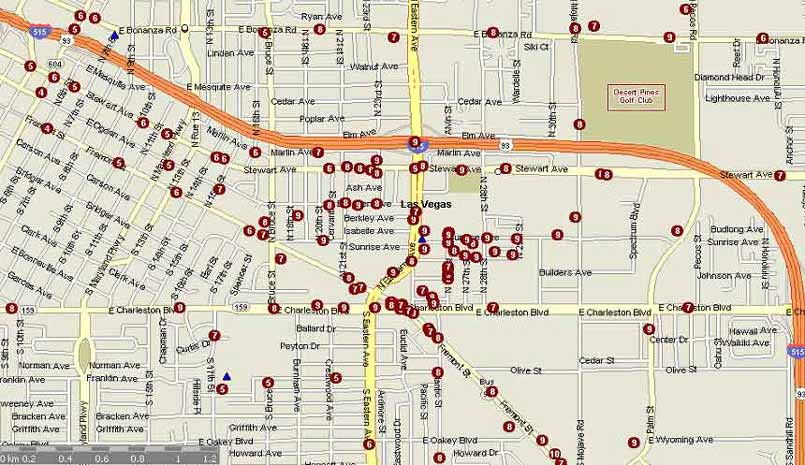
Figure 7. Observed Numeric CO Concentrations (ppm) During December 27 to
28 Evening/Night Period. The concentrations illustrate the drainage flow. The
DAQM sites are shown in blue triangles.
KEY
FINDINGS
Six
of the Clark County DAQM CO monitoring sites are located in the parts of Las Vegas
Valley that experience the higher CO levels, and the Sunrise Acres site is centered
in the area of maximum impact. This observation leads to the conclusion that the
DAQM CO monitoring sites are suitably located to identify the peak CO concentrations
and the corresponding general area in which the higher levels occur.
The highest
CO concentrations measured during the Saturation Study occurred in the vicinity
of the Sunrise Acres DAQM site. This site experienced the highest concentrations
in the DAQM network during recent years. The Saturation Network revealed that
relatively high CO levels extend beyond the major streets in the area and into
residential neighborhoods. The peak 8?hour average CO concentrations indicate
that the higher concentrations (>5 ppm) extend about 1-mile to the north, south,
and east of the peak area. This area includes six of the DAQM CO monitoring sites:
CC, CW, JD, FP, SA and MC (Figure 4). Most of the area covered by the higher CO
concentrations is east of Interstate 15.
The peak 1-hour average CO concentration
measured at the Saturation Study sites was 18.3 ppm; this occurred at a micro-scale
exposure site near Casino Center and Fremont Street. The peak 1-hour averages
at the remaining sites were all less than 10 ppm. These levels are all well below
the 1-hour NAAQS of 35 ppm.
The peak 8-hour average CO concentration measured
during the program was 7.2 ppm. This occurred at the U16 site, which is two blocks
south of the DAQM monitoring site at the Sunrise Acres School near the intersection
of Eastern Avenue, Charleston Blvd. and Fremont Street. This CO level is below
the 8?hour NAAQS of 9 ppm. The peak 8?hour average occurring at the Sunrise Acres
DAQM site (from November 20 through December 2001) was 6.0 ppm, which was during
the same 8-hour time period as the maximum at U16.
At least two secondary
CO peak areas were observed in the Saturation Network that are not as well covered
by the existing DAQM. One area is just northwest of the I15/95 interchange. The
other is along the Boulder Highway where elevated concentrations of CO entrained
in the nocturnal drainage were observed.
In the outlying areas of the Las Vegas
Valley where DAQM monitoring is sparse, measured levels within the Saturation
Network were confirmed to be very low.
Higher than expected CO levels were
observed in residential neighborhoods that are not immediately adjacent to major
thoroughfares. These elevated concentrations may not be related to traffic patterns
but instead, may be the result of other sources of CO, such as space or water
heating. The areas where this was observed are high population density residential
neighborhoods where CO exhaust from older heaters and water-heating appliances
may be significantly higher than in newer neighborhoods.
ACKNOWLEDGEMENTS
This
program was funded and administered by the Clark County Department of Air Quality
Management